Monitor function - DSP 4x00 CableAnalyzer
Within the MONITOR menu there are three Auto Negotiating Ethernet functions. Lets quickly run through each one: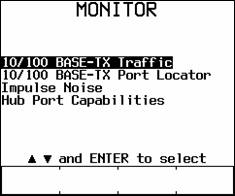 The Traffic Monitor will report Utilization and Collisions. As you can see below, it will also report Jabber. If you need to find out more detail, you need to be looking at Fluke Networks other dedicated Ethernet analyzers such as the NetTool, EtherScope or OptiView. If you are connected to a Switch, you will of course only see the broadcasts on that port. (Utilization will be less than 1%, unless there is a broadcast storm). 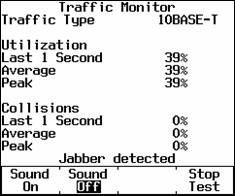 Utilization Last 1 second Percentage of the networks transmission bandwidth used over the last 1 second. Utilization includes correct frames, collisions, and jabber. The percentage indicates the current traffic density. Utilization Average The average of all the 1-second utilization percentages since the start of the test. Utilization Peak The highest 1-second utilization percentage recorded since the start of the test. Collisions Last 1 second The percentage of collision frames as compared to the total number of frames detected in the last 1 second. Collisions are counted when runt packets are detected. Collisions Average The average of all the 1-second collision percentages since the start of the test. Collisions Peak The highest 1-second collision percentage recorded since the start of the test. Jabber Detected If jabber is detected, the message Jabber Detected appears at the bottom of the screen. A jabber is reported if a frame is detected to be larger than the maximum legal size (1518). If no link pulse is detected, the message NO LINK PULSE appears. The Hub Port Locator will flash the Port LED on the Hub / Switch every second, handy for chasing cable runs in messy cabinets. 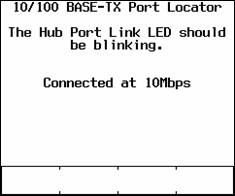  Another useful feature is Hub Port Capabilities. One of the biggest problems we see today is people connecting Full Duplex NICs to Half Duplex Hubs / Switches. This is perfect for detecting the port capability. 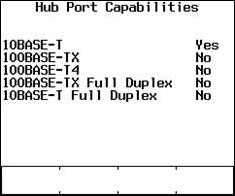 |

