Pair to Pair Alien Crosstalk data - DTX Alien Crosstalk
You can access ALL individual pair alien crosstalk data within the AxTalk Analyzer program. This feature is intended for cable vendors and their labs.
In the AxTalk Analyzer software on your PC, click on Data > ANEXT to Excel. If you require the AFEXT data, first click on PS AACR-F in Test Type, then click on Data > AFEXT to Excel.
If you do not have Excel on your PC, there is an option to export to CSV as well.
추가 정보
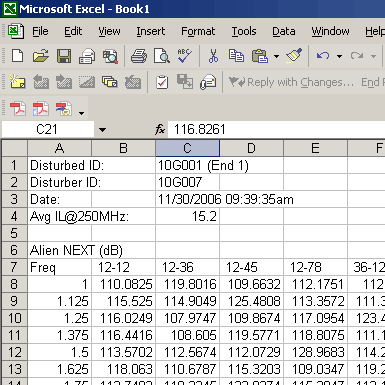
When you look at the result, you will see something like:

A common question resulting from this is that when I look at '12-45 for example, which pair was the victim? The answer is that this does not matter for the pair-to-pair data. In a passive network/cabling system, when you reverse source and load (or look at S12 or S21) the result is exactly the same. You may assume that for the power sum data, the wire pair for which the power sum is reported is at the LOAD terminal.
Another misunderstood aspect of this is when you compare the PSAXtalk from disturbing channel 2 to disturbed channel 1 with the PSAXtalk from disturbed channel 2 to disturbing channel 1. You will find that the power sum results ARE different! Note the following: when you assume channel 1 is the disturbed channel: Pair 1 obtains the coupling from pair 1, 2, 3 and 4 of the disturbing channel 2: ANEXT 12-12, ANEXT12-36, ANEXT 12-45, and ANEXT 12-78.
The first index is the disturbed channel pair, and the second index is the disturbing channel pair.
When you assume that channel 2 is the disturbed channel:
Pair 1 obtains the coupling from pair 1, 2, 3 and 4 of the disturbing channel 1. In terms of usage of pair identifiers of the first example:
used are:
For PS AACR-F the comparison is more complex. In that case, there is symmetry between the data at the near end of the first measurement and the data at the far end for the second set of measurements.
Confused yet? This is why we recommend letting the software do all the reporting for you. This feature is intended for cable vendors and their labs.
In the AxTalk Analyzer software on your PC, click on Data > ANEXT to Excel. If you require the AFEXT data, first click on PS AACR-F in Test Type, then click on Data > AFEXT to Excel.
If you do not have Excel on your PC, there is an option to export to CSV as well.
추가 정보
When you look at the result, you will see something like:

A common question resulting from this is that when I look at '12-45 for example, which pair was the victim? The answer is that this does not matter for the pair-to-pair data. In a passive network/cabling system, when you reverse source and load (or look at S12 or S21) the result is exactly the same. You may assume that for the power sum data, the wire pair for which the power sum is reported is at the LOAD terminal.
Another misunderstood aspect of this is when you compare the PSAXtalk from disturbing channel 2 to disturbed channel 1 with the PSAXtalk from disturbed channel 2 to disturbing channel 1. You will find that the power sum results ARE different! Note the following: when you assume channel 1 is the disturbed channel: Pair 1 obtains the coupling from pair 1, 2, 3 and 4 of the disturbing channel 2: ANEXT 12-12, ANEXT12-36, ANEXT 12-45, and ANEXT 12-78.
The first index is the disturbed channel pair, and the second index is the disturbing channel pair.
When you assume that channel 2 is the disturbed channel:
Pair 1 obtains the coupling from pair 1, 2, 3 and 4 of the disturbing channel 1. In terms of usage of pair identifiers of the first example:
used are:
- ANEXT 12-12 (is the same of what was shown before)
- ANEXT 36-12 (this is NOT the same of what was shown before as ANEXT 12-36!).
- ANEXT 45-12 (this is also NOT the same of what was shown before!).
- ANEXT 78-12 (this is also NOT the same of what was shown before!).
- Measure the ANEXT from channel 1 to channel 2, and save.
- Select channel 2 as the disturbed channel and respond to the prompt for looking for existing data YES (you should find immediately the result of the previously saved data. Then export the results to a spreadsheet.
- Compare the two spreadsheets.
For PS AACR-F the comparison is more complex. In that case, there is symmetry between the data at the near end of the first measurement and the data at the far end for the second set of measurements.
Confused yet? This is why we recommend letting the software do all the reporting for you. This feature is intended for cable vendors and their labs.


