HDTDX - DTX CableAnalyzer
Are you looking to troubleshoot NEXT problems? The following videos are available. Although titled "Category 6", the rules in these videos also apply to Category 5e, 6A, Class D, E and EA links.
The NEXT measurements provided by the DTX CableAnalzyer are requirements of the standard and are reproducible against laboratory equipment; however the HDTDX is a tool to assist the user with fault location and opportunity to improve link performance.
Use of these HDTDX fault finding capabilities to determine exact performance of an individual connector within a link can be difficult, and is variable due to the length, topology of a link and performance of the other components within that link. However, did you know that the HDTDX trace can be used to estimate the performance of an individual connector in a link?
Here we see an HDTDX trace taken from a Category 5e link which had a NEXT margin of 2.4 dB. It is a pass, but for this particular connector and cable vendor we would expect to see larger margins for this particular configuration. The HDTDX trace suggests that the connectors are the issue. The DTX reports the peak HDTDX event to be '25.1'. What does 25.1 represent? Firstly, that '25.1' is an HDTDX value of 25.1%. The cabling standards define the performance of a mated connector as: 54 dB @ 100 MHz for Category 6 43 dB @ 100 MHz for Category 5e The TIA and ISO standards have a specific process defined to do component testing for jacks and cable. These component tests are designed to be performed in a laboratory environment and will tell you what the specific performance of the components are. [DJ1] How can we estimate a connector's performance by looking at just one frequency point? A point source of NEXT, at the location where it is, typically exhibits in the frequency domain a response which has a 20 dB/decade slope. Its intensity can therefore be characterized at any frequency; we chose 100 MHz for ease of use and understanding. It should be noted that the worst case performance of connector may not be at 100MHz but at a different frequency and hence the values of the expected HDTDX result may need to be adjusted.
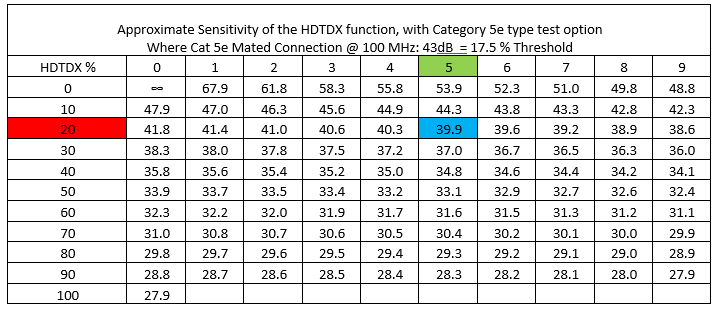
To reduce the impact of very near end connector (the DTX instrument connector itself and the channel adapter connection), The following examples of look up tables provide values for the HDTDX. For example, if we equate a HDTDX threshold of 17.5% to the connecting hardware limit at 100MHz , and the HDTDX value is 25% (as in the trace above), first find the row where HDTX % is 20 (Highlighted red). Then move across the line to where the HDTDX % is 5 (Highlighted green). The point at which they intersect is the value of link NEXT @ 100 MHz (Highlighted Blue).
The formulae for this table is: dB@100MHz = -20*log10(HDTDX/Threshold) + ConnLimit where ConnLimit is in dB, and HDTDX and Threshold are in percent
|