A full version of LinkWare Stats is included in LinkWare PC..
Testing todays advanced cabling plants is so complex that a single Category 5e test report includes more than 400 data fields. 수백에서 수천 개의 링크를 포함하는 일반적인 작업의 경우 모든 결과를 살펴보고 모두 양호하다고 확인하더라도 심각한 문제가 남기 마련입니다.
-
잘못된 테스트 세부 절차가 사용되었는지 쉽게 알아볼 수 있는 방법은 무엇입니까?
-
Which adapter was used?
-
모든 테스터가 올바른 소프트웨어를 사용했습니까?
-
예상하는 허용 범위를 얻었습니까?
-
허용 범위는 일관됩니까?
Fluke Networks has the answer with LinkWare Stats, a results analysis software option that integrates with our LinkWare Cable Test Management Software. LinkWare Stats generates statistics on the cabling links within your LinkWare database then transforms the performance results into summary graphics that give you the analytical information you need, fast.
Whether youre a network owner, cabling contractor or manufacturer, now for the first time, you can quickly see the true performance of the entire cabling plant and spot any anomalies or inconsistencies.
An example of a LinkWare Stats report is available by clicking here (PDF 201 KB)
LinkWare has the flexibility to let you breakdown the results to floor level, as defined in ANSI/TIA/EIA-606-A. An example of a project broken down to building level is available by clicking here (4.6 MB) You will need Microsoft Internet Explorer 5.0 or higher to view the report.
LinkWare Stats works hand in hand with LinkWare cable test results management software. LinkWare gives you the power to manage results data from multiple testers with one single software application. LinkWare Stats gives you the statistical analysis and reporting power to move above and beyond page-per-link reports. It analyzes and transforms LinkWare cable test data into graphics that reveal your cabling plant performance summarizing your entire cabling infrastructure in a compact, graphical format that makes it easy to verify margins and spot anomalies.
-
Get a complete view of cabling plant performance in ways you havent seen before
-
Filter incoming data to highlight exactly what youre looking for
-
View graphs and tables that show margins by test standard, operator, location and other attributes
-
Eliminate the chance that an anomaly gets overlooked; graphs highlight marginal or failed links in color
-
Quickly and easily demonstrate that the installation meets warranty requirements
-
Win more business with professional and customized performance summary reports
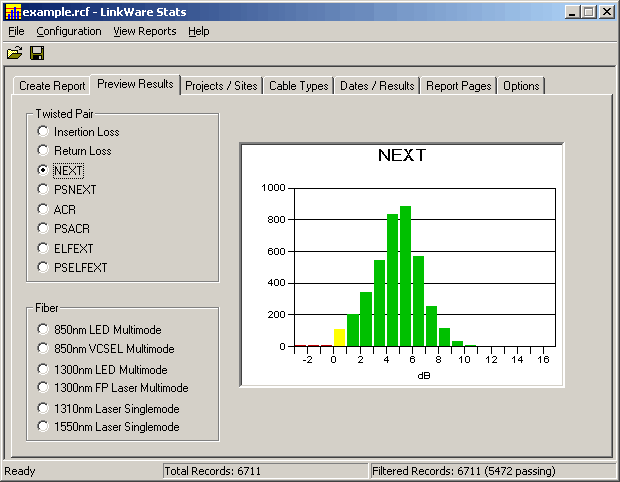
LinkWare Stats gives you an instant overview of your installed cabling plants performance, with plenty of detail if you want it. 한계선 이상으로 헤드룸의 3dB을 약속했습니까? In a simple picture, LinkWare Stats tells you if its there.
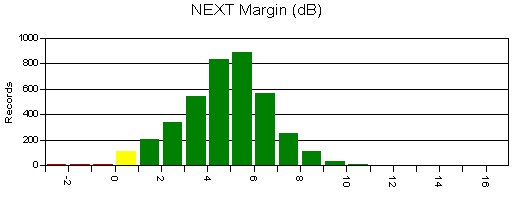
모든 도구가 올바른 테스트를 실행하는 작업에 사용되었습니까?
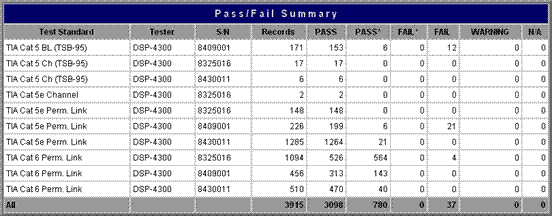
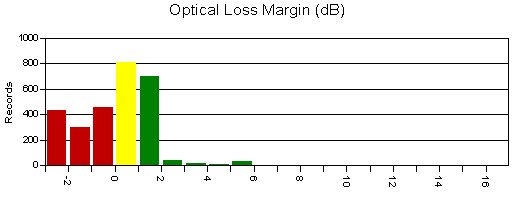
한 눈에 알아볼 수 있다. Want to know the margins for you Optical Fiber Test Results? Its all there for every measurement, floor, building, and test type.
LinkWare Stats를 사용하면 배선 계약업체가 전문가 수준으로 배선을 구축하고 품질에 집중할 수 있어 경쟁적인 업계 환경에서 차별성을 보일 수 있습니다. 또한 사용자 지정 가능한 표지와 전체 설치 작업에 대한 그래픽 요약을 제공하여 귀사의 고객에게 귀사의 작업 품질을 보여 줍니다. 대형 작업을 처리하는 경우 테스트를 진행한지 일주일만 지나도 누군가 잘못된 테스트 표준이나 어댑터를 사용하고 있음을 발견하게 되지 않습니까? With LinkWare Stats, a quick review of the first days results immediately lets you know if youre on track as expected.
설치 후에 어떤 구성 요소의 성능이 더 뛰어난지 궁금한 적이 있었습니까? Its obvious with LinkWare Stats. 제조업체에서 보증 범위를 신속하게 발표하길 원하십니까? LinkWare Stats presents test results the way manufacturers prefer to see them.
LinkWare Stats makes warranty review of installed results a breeze and provides useful data for future designs. At a glance, you can see which pairs had the worst results and at what frequencies they occurred.
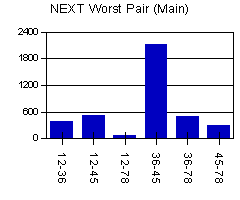 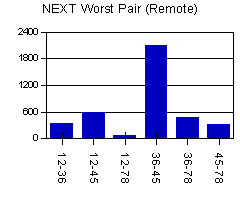
LinkWare Stats also allows analysis over a large population of installed products, so you can review performance by contractor. Whos doing the best terminations? If the average NEXT margins are 5 dB, why is one cluster of results only 2 dB? Are your near and far-end results consistent?
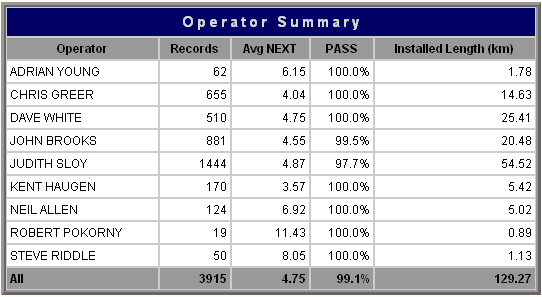
Tired of thumbing through binders of printed test results? Analyze 500 links in minutes with LinkWare Stats. Preview the results before compiling a report.
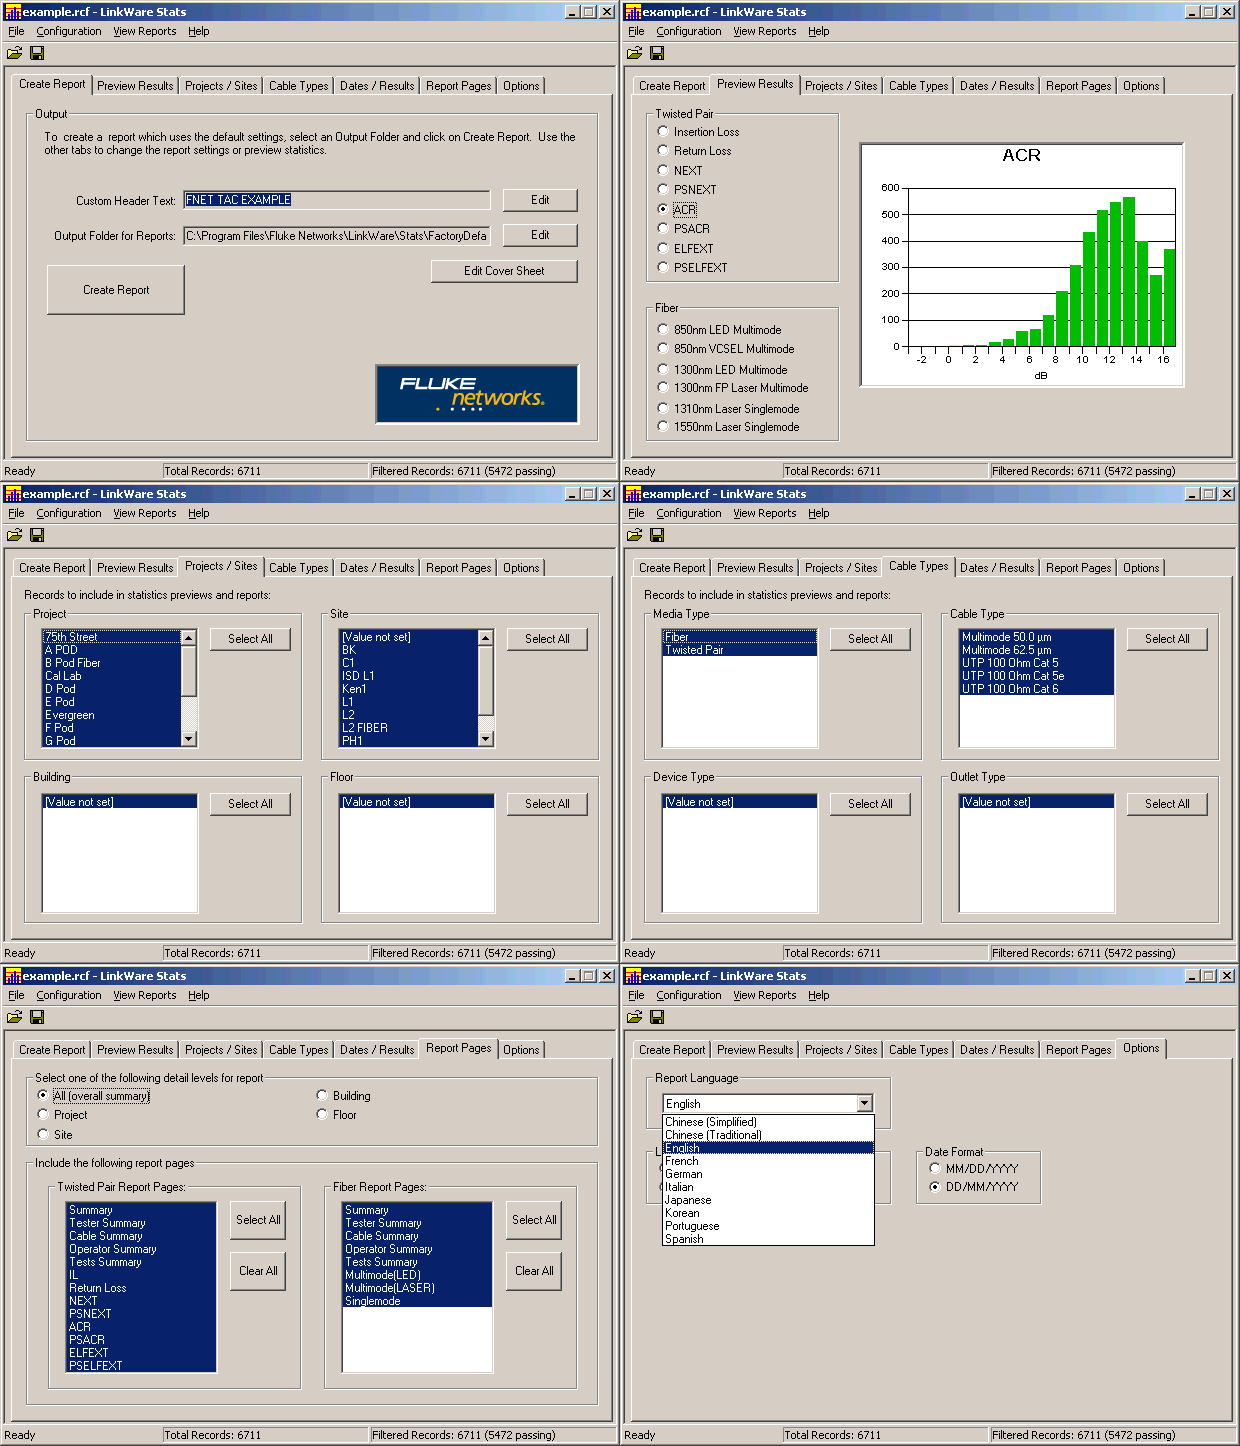
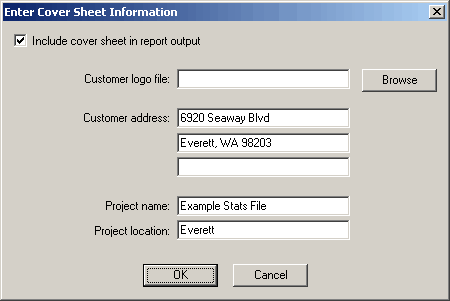
Start with the default setup, add a cover page with your company logo, select the report page types, and preview a sample. One setup is all it takes to save the configuration so you can produce it again easily.
|


