Why do I get “positive loss” when verifying a test cord?
August 1, 2018 / General, 101 learning, Installation and testing, Upgrading and troubleshooting, Best Practices
Verification of test reference cords is easy, right? Yes, usually…but not always. After the power meter is set to 0 dB via the reference procedure, the loss of a mated connector pair is expected to be less than 0.20 dB for single-mode (e.g., -0.20 dB). Let’s examine one scenario where a loss is not negative (e.g., +0.15 dB).
The typical process for validating the loss of a connector, to verify if it is “reference grade” for example, is as follows:
Attach a test cord (TC1) to the light source and measure the output power; set the reference to 0 dB (see Figure 1).

Disconnect TC1 from the power meter, and attach another test reference cord (TC2) between the TC1 output and the power meter; measure the loss at the mated connector pair shown by the dashed circle (see Figure 2).

Collected data on a few test cords showed measurements of expected values such as -0.19 dB and -0.12 dB.
Then, tests are repeated with TC3 (UPC - APC test cord) replacing TC2. This is not a recommended practice and we’ll soon see why. The UPC end is attached to TC1 and the APC end is attached to the power meter. For this setup, the connector mated pair attenuation measurements were +0.27 and +0.23 dB (see Figure 3).

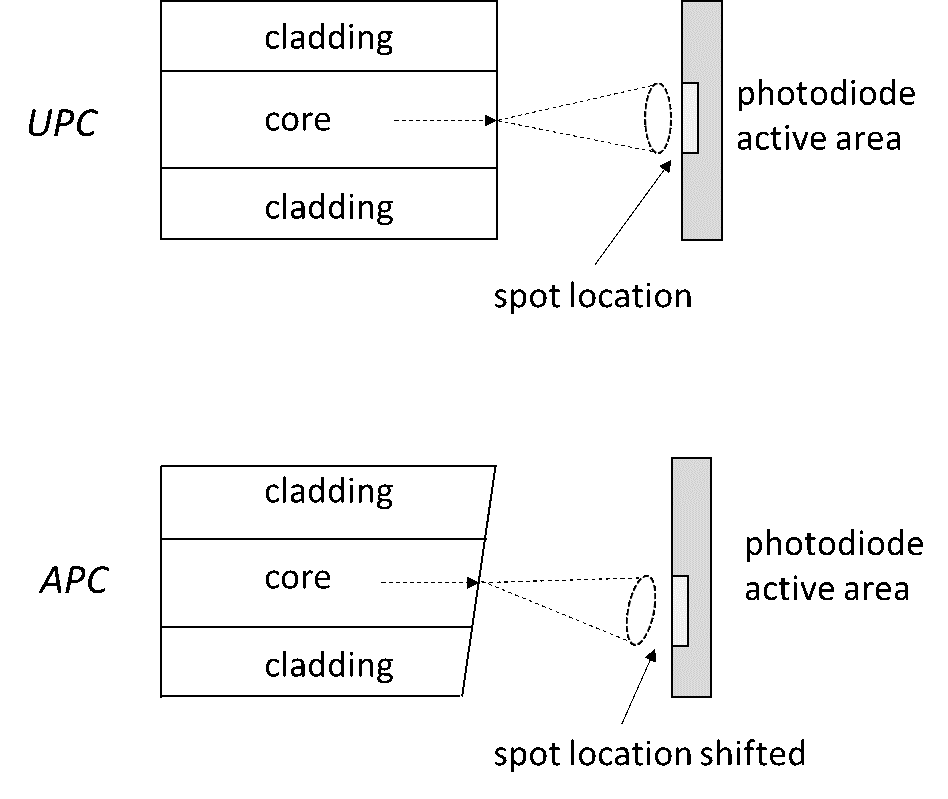
Obviously, more power is received at the power meter but by what mechanism? The amount of light emitted via a test cord having a UPC connector or APC connector, attached to the power meter, should be equivalent. For both the open ended UPC and APC end face, the light exits perpendicular to the end face. From the power meter’s photodiode perspective, the spot size hitting the active area on the photodiode is shifted when the APC test cord is used (see Figure 4). Not only is it shifted, the spot size changes from circular to slightly elliptical.
It is worth noting that the reference could have been made using a UPC-APC test cord (TC1) if testing the loss of an APC-APC mated pair. This could have resulted in a reference measurement made on an area of the photodiode that had higher responsivity. If that was the case, using a receive cord, APC-UPC, with the UPC end connected to the power meter could just have easily produced a negative loss.

Repeating this experiment with a different power meter, typically used in a lab, is more predictable. There was no significant difference during connector loss measurements when the optical power meter interface was a UPC or APC connector. Measurements were negative in both cases.
What is the culprit? Photodiode non-uniformity describes how light is converted to electrons at any location on the active area of the photodiode. If the photodiode has good uniformity, its response will not vary depending on where the spot size lies. The result could be higher power readings as shown here, or lower power readings implying more loss. Optical power meters used in the field typically have higher uncertainty than laboratory optical power meters. Photodiode uniformity may be specified, selected, screened, or tested for laboratory power meters, at a cost premium but may not be needed for field equipment. While this situation is uncommon in the field it clearly illustrates a characteristic of power meters that shows you why you should not mix UPC and APC when making measurements. When making optical power measurements, any sort of change from the reference step to the measurement step is a change of conditions and should be avoided.
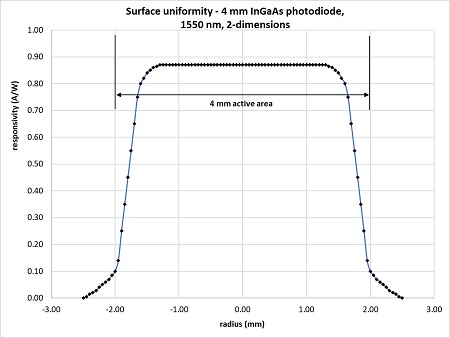
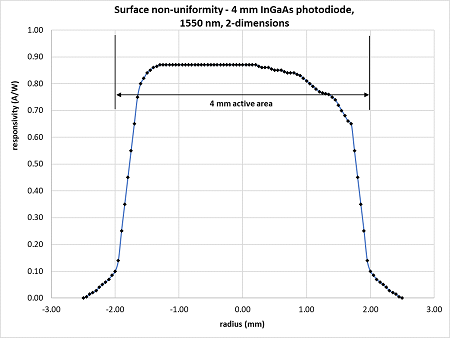
Detectors can have a difference in optical to electrical conversion across their surface, for different wavelengths, and for different power levels. Imagine the photodiode is scanned across its active area in the x and y axis. A plot of such a scan could reveal a surface that may not be uniform. Another way to explain this concept is to examine a 2-dimensional graph of responsivity versus location along a 3 mm photodiode. A detector with perfect uniformity, at least in this view, is observed (see Figure 5). A detector with non-uniformity is represented as having a different responsivity along the detector active area (see Figure 6).
Conclusions
- Don’t mix/join UPC and APC connectors together
- Reference your power meter with a UPC connector and measure attenuation with a UPC connector
- Reference your power meter with an APC connector and measure attenuation with an APC connector
- Photodiodes can have a non-uniformity along the entire active area (surface of detector)
- Photodiode non-uniformity can cause small changes in measurements if the spot size emitted from a test cord is changed in size or location.
최근 게시물 모두 보기 >
네트워크 및 케이블 테스트를 위한 최고의 가이드
2025-5-29
Wi-Fi 7 대 Wi-Fi 6: 새로운 기능 및 네트워크에 대해 갖는 의미
2024-11-25
Versiv™ 릴리스 6.12, 시간 절약, 정확도 향상, 재테스트 감소
2024-10-14
제3자 네트워크 케이블 인증: 알아두어야 할 사항
2024-9-18
삽입 손실 대 반사 손실
2024-8-14
추가 일반 게시물 모두 보기 >
Top 10 Cable Testing Mistakes to Avoid
2025-6-05
네트워크 및 케이블 테스트를 위한 최고의 가이드
2025-5-29
VSFF 커넥터에 대해 알아야 할 사항
2025-5-27
DC 저항 불균형: 알아두어야 할 사항
2025-5-20
LinkIQ™ Duo로 Wi-Fi 분석을 간소화하는 방법
2025-1-28


©2006-2021 Fluke Corporation。保留所有权利。
RM2011, 20/F, SCITECH Tower, 22 Jianguomenwai Avenue, Chaoyang District, Beijing, China
地址:北京市朝阳区建国门外大街22号赛特大厦20层2011室
联系电话:400-8103435
沪ICP备11037028号-15![]()